Posted by: nik | December 11, 2014

Roof Rake Reinvented

‘Tis the season for getting buried! Vermont just got its first real winter storm. For those of us with solar roofs, this means not only shoveling out the driveway, the walkway, the vehicles, etc, but might also include clearing off the panels on the roof so they can do their magic.

My first winter here I used a plastic roof rake. It works OK but the edge sometimes get caught on the bolt heads that stick up above the solar panels. So last winter I upgraded to a hybrid pushbroom contraption. A client of mine came up with this design. The telescoping handle from the plastic roof rake gets bolted onto the pushbroom head. Here are the steps:

image

1) Buy a pushbroom and a plastic roof rake with extension handle. I picked these up at my local Ace Hardware Store. (I actually ended up using a different broom than the one shown.)

image

2) Modify the part of the roof rack handle that bolts to the rake head.

image

3) Modify it some more.

image

4) Keep trying!

image

5) Use the old “bar-of-soap trick” to get the handle into the broom head

wpid-img_20141211_194314360.jpg

6) When you finally get the slightly-too-large post into the socket, put a screw through it to make sure it doesn’t come loose.

image

7) Now use some self-tapping screws to attach the stabilizing arms.
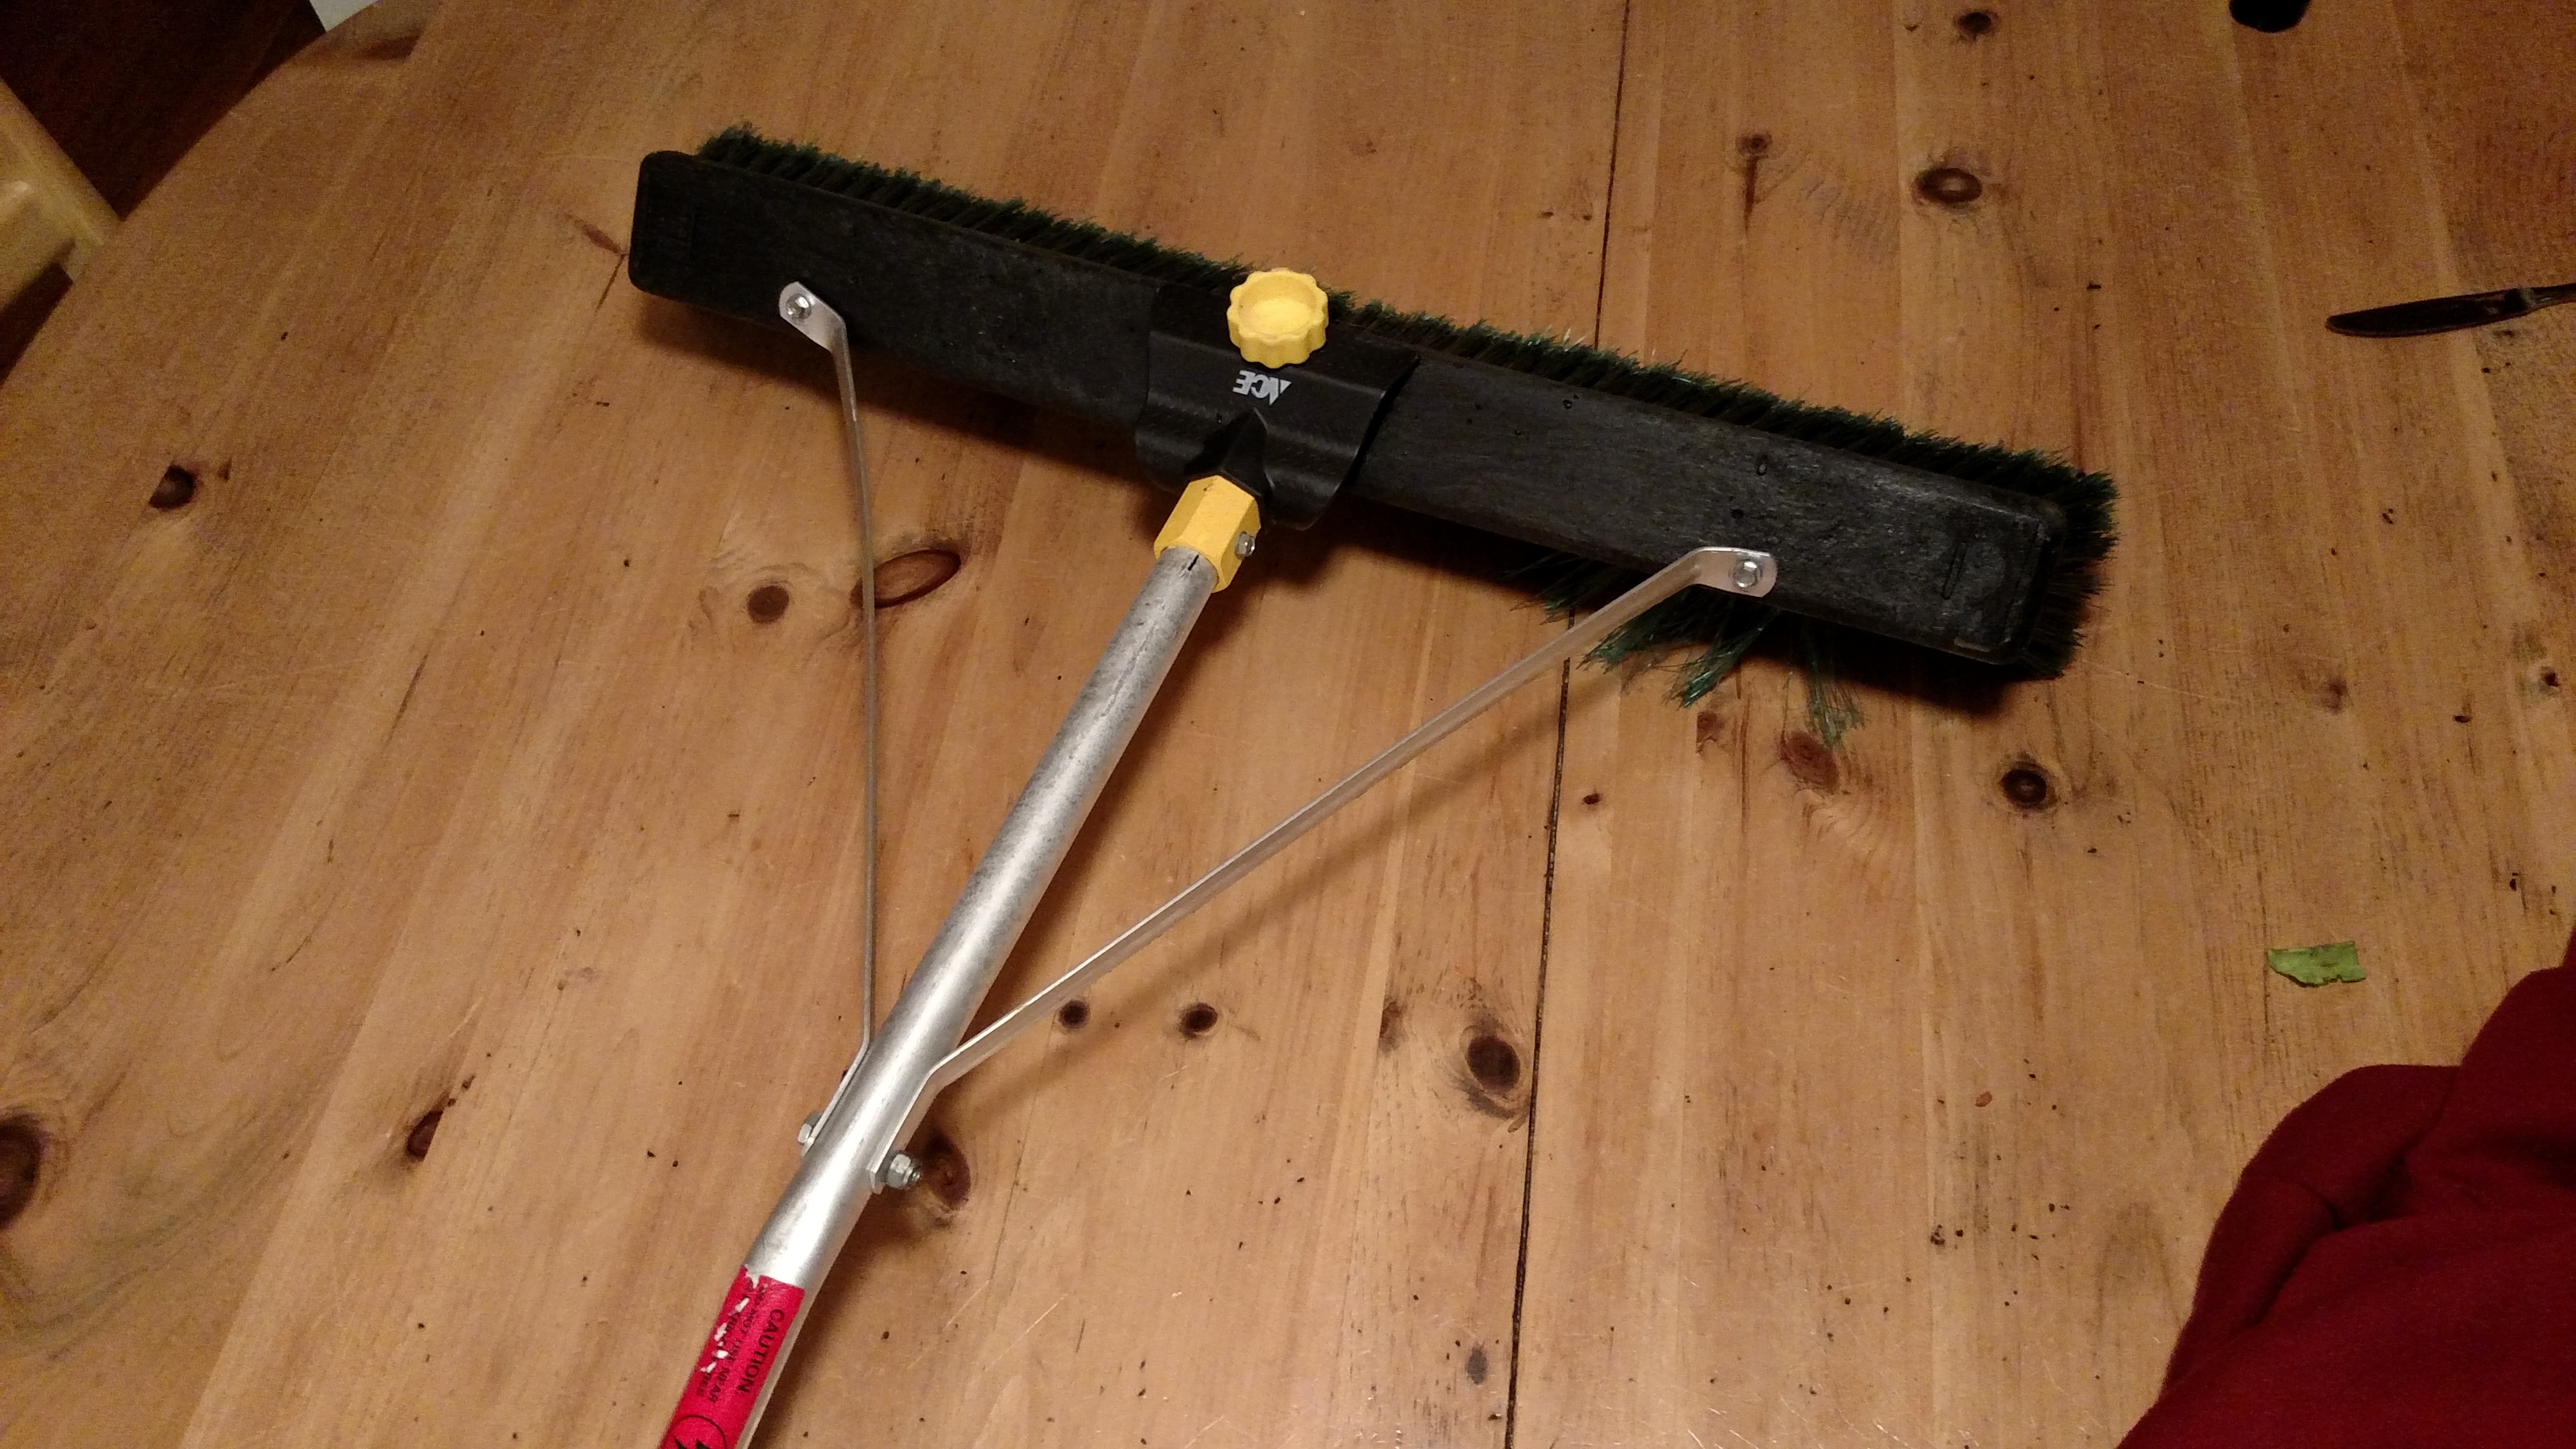
wpid-img_20141211_191132840.jpg

FINISHED!

Now the real work starts.. Pulling and pushing heavy wet snow 10 to 20 feet above your head. I actually use both attachments depending on type of snow. A light dusting is best cleared with the broom head.

image

But the kind of sno-cement we had on there today required a pass with the rake, then cleaning it up with the broom.

wpid-img_20141211_071126660_hdr.jpg

BEFORE

wpid-img_20141211_100858924.jpg

AFTER

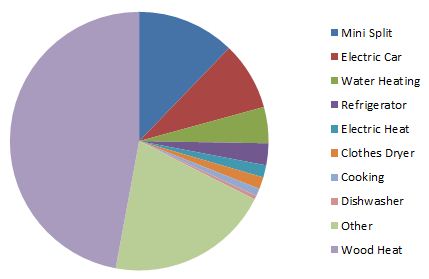
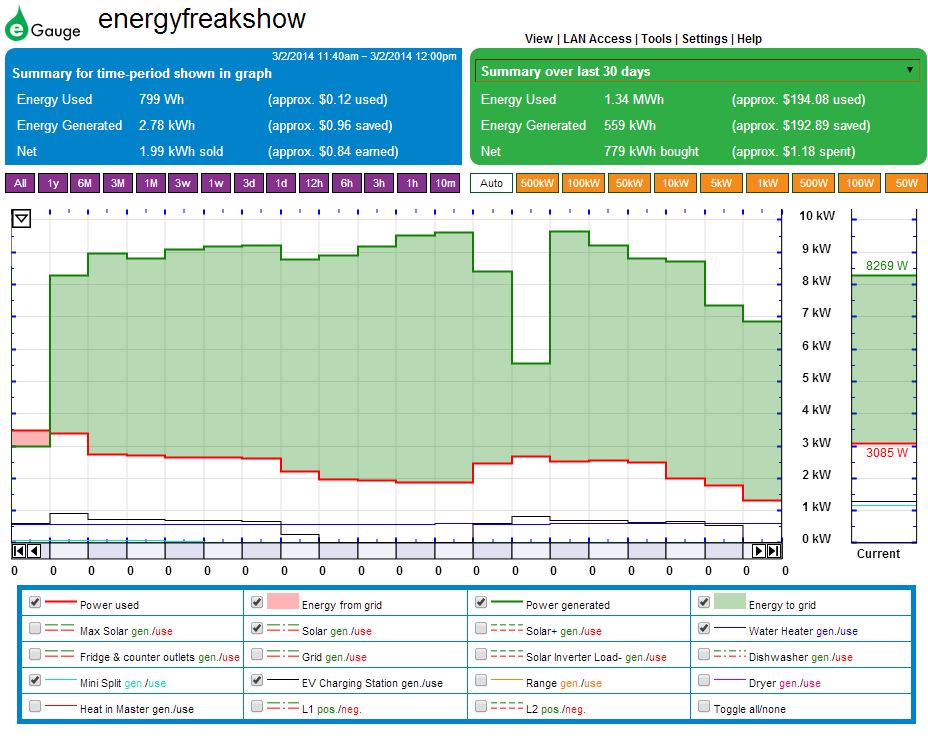
Was all that effort worth it in the end? Probably not. We only generated 4 kWH today and used over 28. But as I’ve said before, I can’t make my own energy but I can harvest it! And that brief moment mid-day  when the power meter runs in reverse, that’s always worth it in my book!

2014-12-11

Posted by: Li Ling Young | June 14, 2014

One Year Measured

We’ve had our whole home Energy Monitor keeping tabs for one year now.  Here’s how our energy breaks out…

After one year we can see what our big energy users consume.  This helps us make decisions about where we invest in energy saving improvements.

After one year we can see what our big energy users consume. This helps us make decisions about where we invest in energy saving improvements.

The first thing to notice is that the total energy used (“Usage” in red) is almost exactly the same as the energy our solar system produced (“Generation” in green).  That’s really just coincidence.  Lately I’ve been doing energy modeling to help people size their solar system, and I can tell you it’s never that accurate.  Plus, we didn’t even do an energy model to figure out how much solar we’d need; Nik and I just put as much PV on the roof as would fit.  We even reconfigured the layout to fit one more row of panels up there.  Nonetheless, it’s nice the numbers are so close because it means we’re still not paying anything to the utility, and they even owe us money because of the feed-in tariff.

Next I look at the energy our mini-split heat pump used over the year.  This is almost entirely heating, although I will admit to a few days of cooling last summer – but just a few!  I tried to use the mini-split as much as possible because I didn’t want to have the big electricity surplus we had last year, and I wanted our wood to last the winter.  2.51 MWh (“megawatt hours”) is 2510 kWh (“kilowatt hours”) – a very small amount of energy for heating in this climate.    However, you have to add in the electric resistance heat that we used in parts of the house that weren’t kept adequately warm by the heat pump: 313 kWh for “Heat in Master”, and perhaps another 100 kWh for plug in electric heaters that we didn’t keep track of.  So, all told we used 2923 kWh for heat last year.  Still very low, and still not accounting for the wood we burned.  My best guess on the wood is we used up 3 cords, and making a lot of assumptions that equals about 9600 kWh.  You can see that even if my numbers are off by 50% wood burning still represents the biggest piece of our energy pie.  All in, heat is about 60% of our total energy used.

Water heating energy is less than 1000 kWh – a good deal, but at the expense of a very cold basement.

The refrigerator uses about 550 kWh: pretty good considering it’s probably ten years old.

The dishwasher uses less than 100 kWh, a huge disappointment to me because I want to replace that old, brown dinosaur, but I certainly can’t do it on grounds of energy savings.

Clothes drying represents only about half of our actual clothes drying because we use the clothesline for at least half the year.  It’s gratifying to see all that work hanging clothes pays out in a pretty big way.

Finally, the electric car…  We haven’t had the car for a year yet, but just a few weeks shy.  This summary shows 1750 kWh put into the car from our Level 2 charger, but for several reasons that’s not the actual annual total.  I looked at data Nissan keeps online and the total we put into the car since we got it is 2209 kWh.

Here’s a much better way to look at all the energy uses

When you add in the wood heat, this is our total household energy mix, including driving.

When you add in the wood heat, this is our total household energy mix, including driving.


Posted by: nik | March 3, 2014

Edge-of-Cloud Effect

It’s March! The sun is getting higher in the sky, days are getting longer, and equinox is only a few weeks away. It’s that time of year when cabin fever sets in and spring just won’t come soon enough. But it is also the time of year when we see the highest power readings from our solar electric array. The nominal peak DC power rating of our whole system is 9.36 kilowatts . That means under “Standard Test Conditions” (1,000 W/m2 solar irradiance, 25°C PV module temperature and air mass of 1.5) the panels will be providing 9,360 Watts of power to the inverters.  The inverters are the electronic devices that convert this DC solar power to typical AC power to be used in the house or sold back to the utility. The inverters operate at about 98% efficient. There are also some losses due to shading, inefficiencies in the wiring and connections, soiling on the panels, less than ideal orientation, etc, etc. For design purposes we usually use a derating of about 75% of the system STC rating. So it is very rare that you will ever see the output of your solar PV system at or above the nominal DC rating. This is usually the time of year that it happens. The  operating temperaures are good (colder is better for the semiconductor effect) and the moisture level in the air is at a minimum. The following chart is a 10-minute snapshot of our power profile for yesterday at noon. The green line is solar power reading (updated every minute) and red line is our consumption.

The Edge-of-Cloud Effect at work

The Edge-of-Cloud Effect at work


You can see sustained solar readings over 9,000 Watts during this period and a spike up over 9,500! That’s  9,560 AC Watts! That’s 200 Watts above the DC rating of the array! The dip right in the middle of the chart is a small cloud passing in front of the array. As the cloud moves away this is when the highest reading happens. This is known as the “Edge-of-Cloud Effect.” The sunlight is being magnified as it passes through the moisture droplets in the edge of the cloud. The other conditions (temperature, sun angle, minimal shading, etc.) all combine to give the highest solar output reading of the year.

Happy March!


« Newer Posts - Older Posts »

Categories