Posted by: nik | May 25, 2013

Rainy Day Energy

It’s 45 degrees outside (yes Fahrenheit!) That’s 25 degrees below my comfort level.  It is also quite damp and raining. It’s not quite cold enough for a wood fire but it’s great weather for a heat pump! Our Mitsubishi HyperHeat has been keeping it nice and cozy in here. And doing it on a budget too!

The chart below shows our energy production in green and consumption in red over the last 3 hours. The solid green area is excess solar energy that was sold back to the utility. Solid red area is energy we bought from utility when our load exceed our solar generation. The white area under the graph is energy that we generated and then used on-site.

Rainy-Day-Energy

Even with all the rain and clouds our 9kW solar PV array is covering  all the energy loads of the house. This includes the heat and hot water, refrigerator & even the coffee maker!

Posted by: nik | May 18, 2013

Temperature effect on Photovoltaic Output

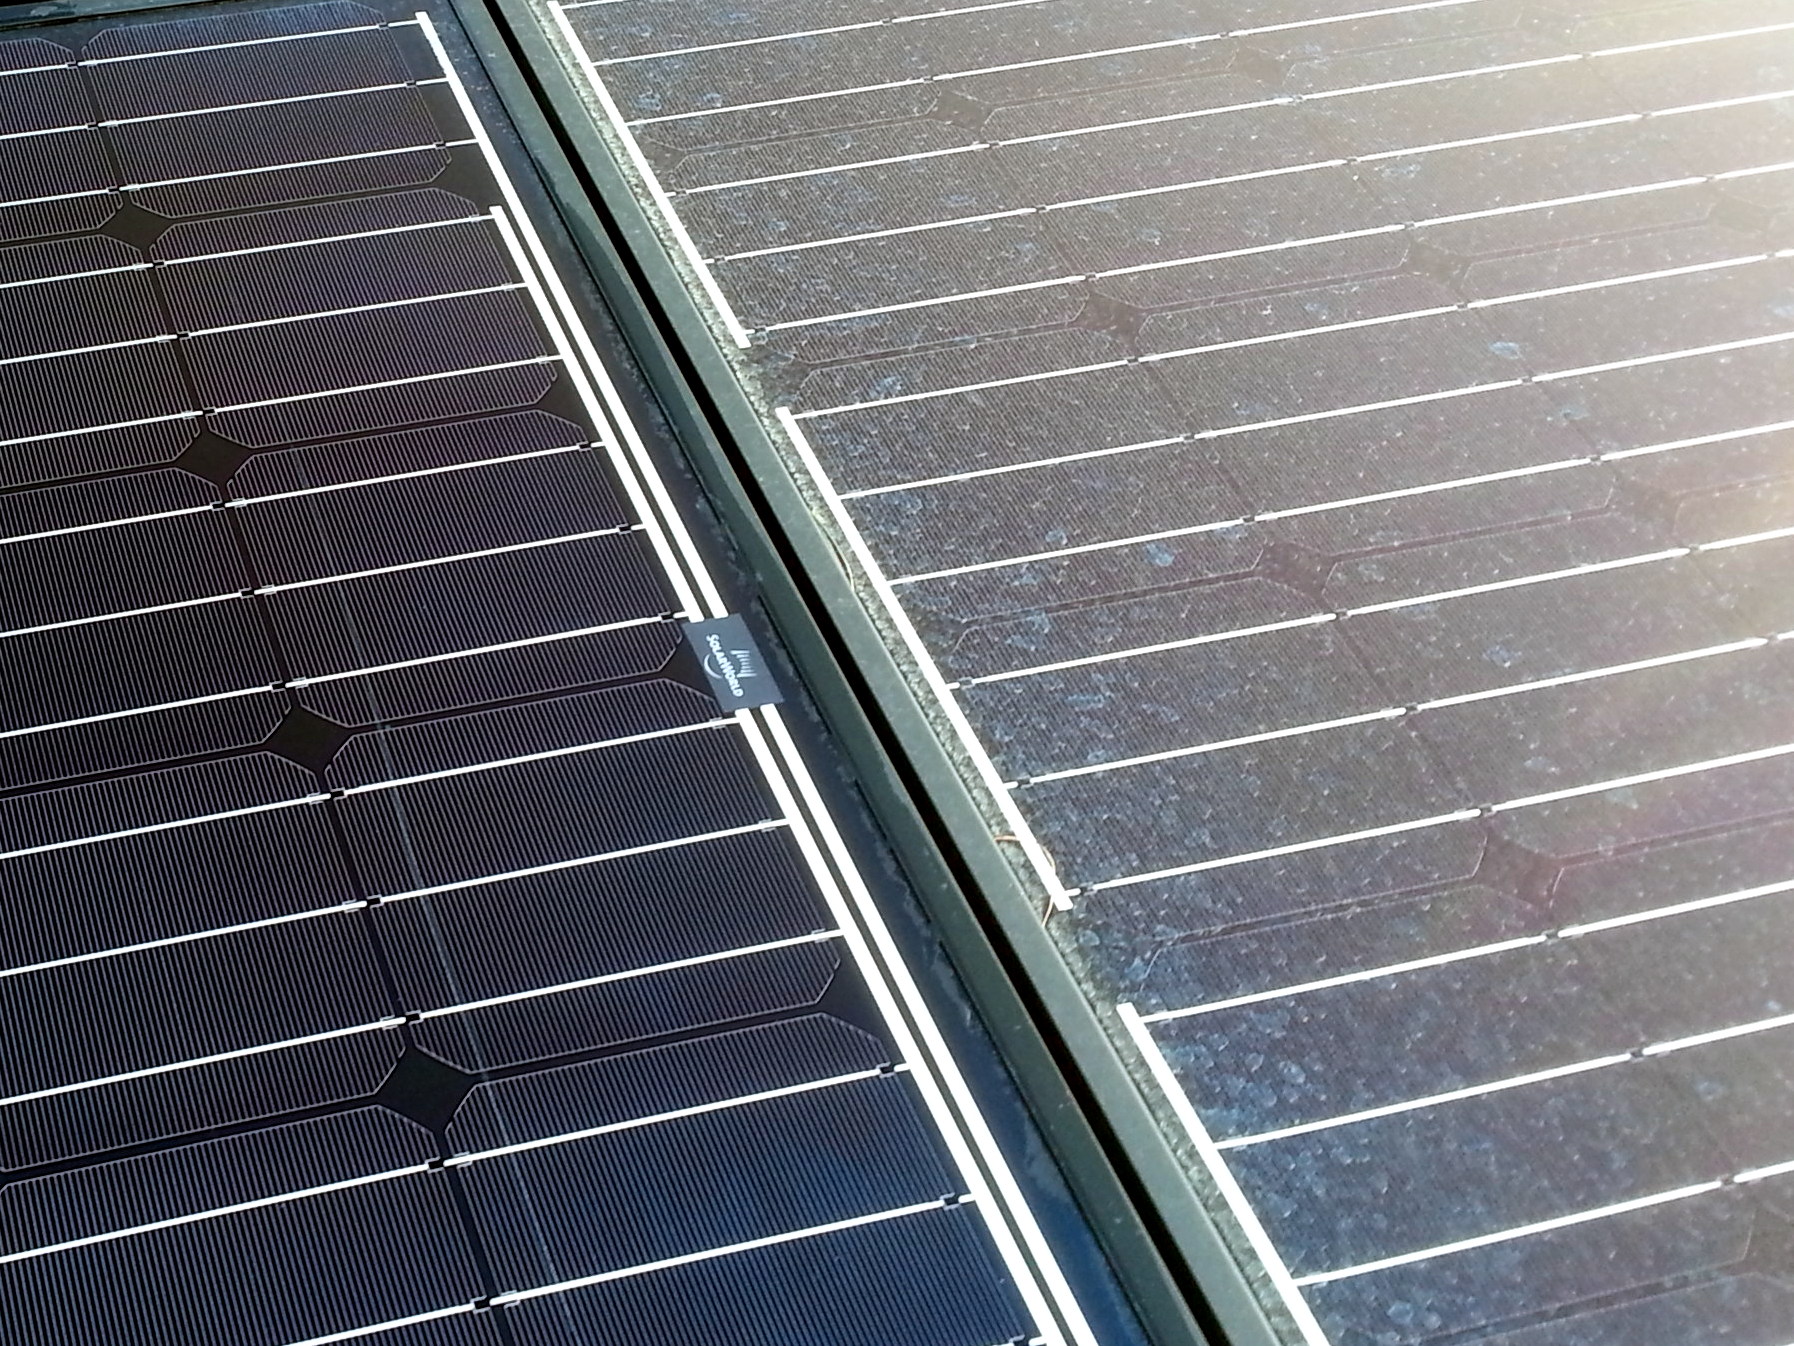
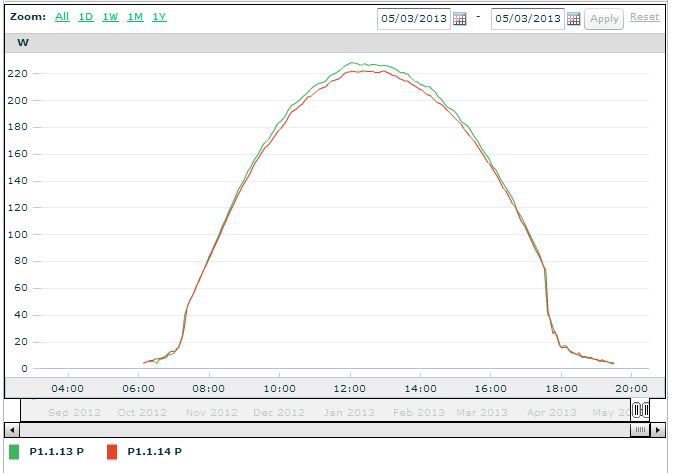
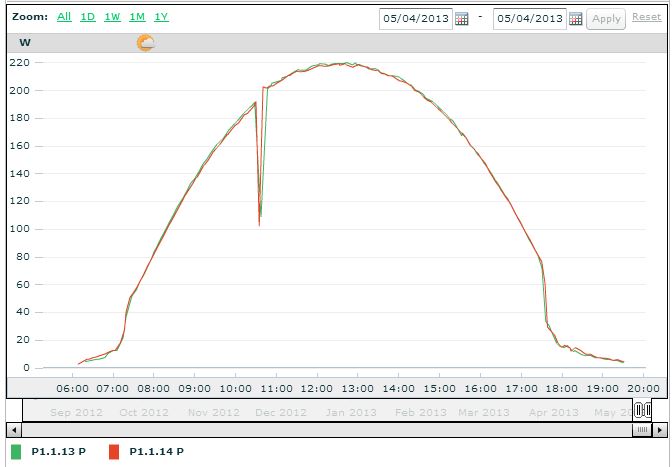
My recent post about clearing dust off panels elicited a very insightful comment from a reader. Kevin@unkilo wondered “if the dip caused by you cleaning the panels takes away the benefit gained by cleaning the panels?” I looked into the data and he was right to question it. My shadow caused a reduction in production almost exactly equal to the boost I received after the panels were dust-free. So when I went up there today to give them a hose-down (my new Saturday morning ritual) I was careful not to shade the panels with my body. Here is the resulting power profile:

Power Generation via eGauge

Power Profile via our eGauge meter

The green line is solar power readings every two minutes. The red line at the bottom of the chart is our consumption (which I’ll save for another discussion.)  But do you see that funny spike at 11am? Obviously, that’s when I was out washing them off. But why does the power spike and then drop back down? What’s going on there?

Well, I’m glad  you asked because it’s an important effect to understand. The solar photovoltaic process has a significant temperature component. As I have described before, The typical solar cell is a silicon semiconductor, just like the CPU chips in our computers, and they operate more efficiently when they are cool. Here’s a very visual and obvious demonstration of that effect. the spike you see in the chart above happened when I sprayed the panels down with nice cold tap water from the garden hose. The panels had been in full sun all morning long and were quite hot at that point. The ambient temperature was close to 70F and I could actually see steam rise off the panels when the cold water hit them. Washing them actually had a multiplying effect, at least temporarily, because they were exposed to more light (dust and pollen had been removed) AND they were operating at a higher voltage thanks to the cold shower.  Of course the temperature effect only lasted 10 or 15 minutes until the panels warmed back up again from the intense mid-day sun.

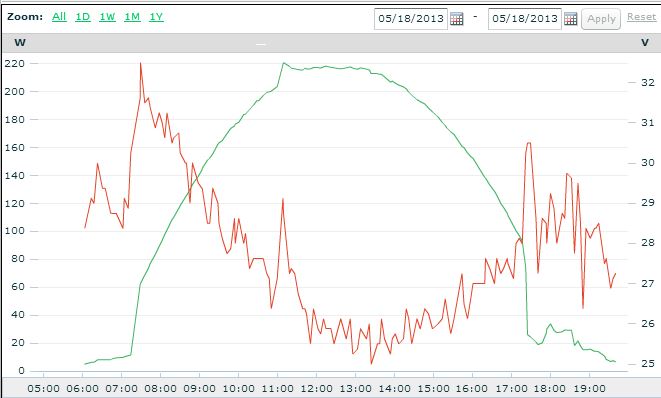
Here’s the plot of both power and voltage for one of the modules:

Power & Voltage (Panel #1.1.11 )

Power & Voltage (Module #1.1.11 )

You can see, there is a voltage spike that corresponds to power spike just after the 11am cleaning. The highest voltage readings are first thing in the morning as the sun is just coming up and the panels are nice and cool. Then the voltage drops off all day as ambient and cell temperatures climb. Then at the end of the day, the sun went behind the trees and power dropped off but the voltage spiked again.

The moral of this story is, temperature matters. Ground mount solar arrays will consistently out-perform roof mount arrays because of this effect. There are even some innovators out there working on hybrid PV & solar thermal collectors to keep the PV cool AND provide pre-heated water at the same time. Seeing this effect today definitely made me think again about that possibility.

Until next time, Keep Cool and Power On!

Posted by: nik | May 5, 2013

The Dust Up

I posted a few times last winter about clearing the snow off the solar panels…or not. It seems like that particular dilemma is finally behind us, at least for the time being, but now we have to contend with a new challenge, dust! We haven’t had any rain for more than 2 weeks and there’s none in the forecast either.

nothin' but sun!

Nothin’ But Sun!

The dust and pollen have been building up on the solar panels so I decided to see if it actually has a measurable impact. As my luck would have it, the 2 lowest modules in the array have a very similar power production history. The panels are guaranteed by the factory to produce at least 250-watts under ideal conditions (also known at Standard Test Conditions) to within +5% or -0%. That is a very tight tolerance but these two control panels have been producing within about 0.5% of each other.  This makes it easy to see relatively small changes in output due to various conditions. (See entry about Solar experiment du jour.)

As the sun was coming up Friday morning I got up on the roof and cleaned the array (with a garden hose & squeegee.) But I left the layer of dust on the PV panel that would serve as the control subject of my experiment.

pretty cruddy, right?

pretty cruddy, right?

As painful as it was to leave the dirty module alone, I did it for science. The next day I checked the production numbers and sure enough, the dusty module had a noticeable reduction. Here is the power chart for the 2 modules.

Clean module in Green. Dirty module in Red.

Clean module in Green. Dirty module in Red.

The energy totals for the day differed by 36.75 watt-hours (or 0.03675 kWh.) That doesn’t sound like much but remember, this is just one module out of an array of 38 modules. If we assume the effect is consistent across the array, the total result would be a loss of about 1.4kWh for the day. In dollars and cents, this still isn’t very significant  ($0.28 worth of energy credit on our electric bill.) But consider this; 1.4 kilowatt-hours is roughly how much the refrigerator uses on a hot day in order to keep our veggies fresh and our ice cream frozen. How much is that worth to you?!

Post Script: Here is the power chart for the same modules the following day. The precipitous dip in production at 10:35am was because I was up there washing them both (and shading them temporarily with my body.)

after cleaning, the 2 panels are back to producing power to within 0.25% of each other

after cleaning, the 2 panels are back to producing power to within 0.25% of each other

The panels are already getting cruddy again just 24 hours latter. Pray for rain but pray it comes at night!

« Newer Posts - Older Posts »

Categories